Camarilla Pivot Trading -A mysterious, most successful and simple trading method.
Getting the accurate trend or the direction of the market is the toughest part of a trader's success. Historically traders used so many methods to find the most suitable probability. High, Low and Last, and start price of a period, average of these prices and change in participation (volume) is the only data you may have in hand. Trade scientists created a lot of statistical tools using these data.
Pivot Levels
Pivot levels are one such successful method used globally for day trading. Pivot is calculated using the average of a particular price and period to understand a level of increased buying or selling interest.
For example, Let's assume the market has opened at 10 and moved higher to 30, and touched a low of 5 before closing at 15 with 100 participants. Here
High=30 Low=5 Open=10 Close=15
Pivot is calculated normally (High+Low+Close/3) but other different methods are also available. The Pivot is considered the most critical point of the day. A break above or below the pivot level is considered or proved as a market moving towards that side. So Pivot and its ascending and descending levels are considered resistance and support levels.
Camarilla and the equations
Camarilla is the advanced version of Pivot calculation founded by Nick Scott a prominent and successful bond trader in 1989. Camarilla is a Spanish word that means "advisor group of the king". It has the level of 6 support and resistance levels each. It has been calculated using the difference in high and low from the closing price using a series of math numbers.
A lot of people mention this as Fibonacci level but it is very difficult to say Fibonacci used anywhere in this pattern. Even though the actual math series used by Scott is unknown. The formula is widely accepted as a good technical tool.
Scott developed the formula based on the previous period range which is simply calculated by dividing high and low. A series of numbers 2,4,6,12 taken as the range numbers. Scott divides these numbers from 1.1 and reaches a percentage of range.
4th =1.1/2= 0.55= 55%
3rd =1.1/4=0.275= 27.5%
2nd =1.1/6 =0.183= 18.3%
1st =1.1/12= 0.916= 9.16%
So if the Range (high-low) is X points then multiply with these series and add/subtract it with the closing price.
Another two levels beyond the range are considered to be breakout levels. Different versions are available to calculate the breakout levels. The simplest solution of all findings is mentioned below.
5th =1.1/1.33=0.824=82%
6th = 1.1/1= 1= upto 111%
the last level is not exactly 111% its the approximate calculation derived from Camarilla calculation for simple understanding.
Resistance(Rn)= (Series * Range)+Close
Support(Sn)= Close- (Series * Range)
So Scott used numbers 1,1.33,2,4,6,12 as the key constants to calculate the Camarilla levels and these numbers are nowhere related to the Fibonacci series.
I have mentioned the formula for your convenience
h1= (0.0916*(high-low))+close
h2 =(0.183*(high-low))+ close
h3 =(0.275*(high-low))+ close
h4 =(0.55*(high-low))+ close
h5 =(0.8244*(high-low))+ close
h6 =(1.0076*(high-low))+ close
L1 = close-(0.0916*(high-low))
L2 = close-(0.183*(high-low))
L3 = close-(0.275*(high-low))
L4 = close-(0.550 *(high-low))
L5 = close-(0.8244*(high-low))
L6 = close-(1.0992*(high-low))
How to decide a trade using Camarilla
Trading is done based on the open price on the trading day/period. Use the first 15 minutes' average price as the open price. Depending on the open price there can be different scenarios.
| Case | Open Price | Action | When? | Target | Stop |
| 1 | H3>L3 | Buy | Crossing L3 from below | H1,H2,H3 | L4 |
| Sell | Crossing H3 from above | L1,L2,L3 | H4 | ||
| 2 | H3<H4 | Buy | Crossing H4 | H5,H6 | H3 |
| 3 | L3>L4 | Sell | Crossing L4 | L5,L6 | L3 |
Detailed explanations are not available for the Camarilla equation and the constants especially, the author has not revealed much about it. The Camarilla is considered to be the perfect choice for day traders since it can manage both trend reversal and breakout markets or the Camarilla is the best fit for both rising/falling or range-bound markets.
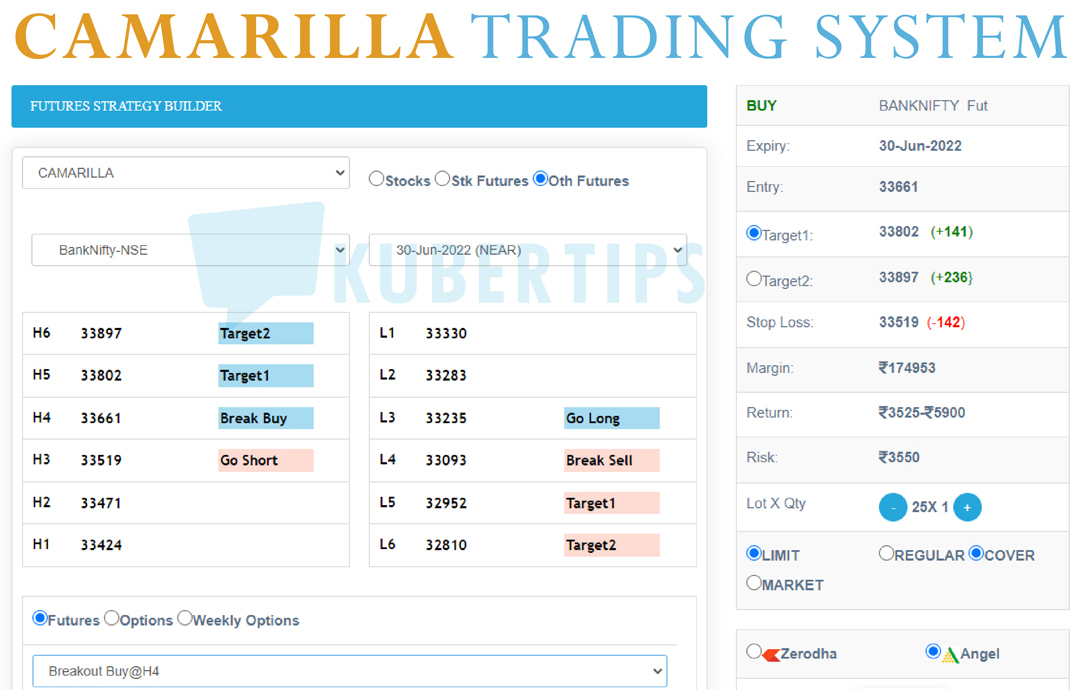
TradingBee has a free Camarilla calculator to find the daily trading range for Stocks, Stock & Index Futures, and Commodity & Currency futures for all contracts. You can generate free futures or stock signals for NSE/MCX. Further, convert these signals to an options trade or strategy, and lastly, just send the orders to your broker with a click.
0 Comments