Fibonacci for Day Trading- A successful strategy for continuous Bullish or Bearish Market
The Fibonacci series is a sequence of numbers starting from zero arranged so that the value of any number in the series is the sum of the previous two numbers starting from 1 and ending in 0. The percentage levels calculated between them are 1, 0.61, 0.5, 0.38, 0.23, 0.
Each new number is the sum of the two numbers before it. As the sequence progresses, each number is approximately 61.8% of the next number, approximately 38.2% of the following number, and approximately 23.6% of the number after that.
0, 1, 1, 2, 3, 5, 8, 13, 21, 34, 55, 89, 144, 233, 377, 610…
What is the importance of 61.8%?
61.8% is considered the "Golden ratio" and describes predictable patterns in everything from small atoms to large stars in the galaxy. The ratio is derived from something called the Fibonacci sequence, named after its Italian founder, Leonardo Fibonacci.
Nature uses this ratio to maintain balance, and the financial markets follow the same.
How are Fibonacci percentage levels used in trading?
Security prices fluctuate upward, downward, or rangebound ways. They will often form trends in one direction or another and then bounce back against those trends. Moves in a trending direction are called impulses and moves against a trend are called pullbacks. Fibonacci levels highlight areas where a pullback can reverse and impulse can advance in the trending direction.
What is Fibonacci Retracements?
When a stock is trending very strongly in one direction, the belief is that the pullback will amount to one of the percentages included within the Fibonacci retracement levels: 23.6%, 38.2%, 61.8%. Some models also include 50% but it is not a Fibonacci percentage. These Levels are calculated using the high and low points of the trading period. Starting from the first at 100% (the high on the chart), the second at 61.8%, the third at 50%, the fourth at 38.2%, and the last one at 0% (the low on the chart). After a significant price movement up or down, the new support and resistance levels are often at or near these lines.
What are Fibonacci Extensions?
Pullback represents retracement but an impulse that breaks the pivot and moves beyond the high (above 1) is mentioned as a Fibonacci extension or expansion. This may be naturally 1.23%,1.38%.1.5%,1.61%,2.0%,2.38%, and so on.These levels are naturally mentioned as targets for a retracement. Fibonacci has got both upside and downside retracement strategies with exactly opposite extensions.
How to make trading decisions using Fibonacci?
Traders take 1 (100%) as open or low and 0 (0%) as the close or high in a bull market and 1 as open or high and 0 as the close or low in a bear market.
A continuous bull market is always correct before moving to a new high or in a bear market to a new low. This helps traders to make a buy/sell decision on a respective trend.
A high or low level of the respective period has been taken as pivot in the Fibonacci trading strategy and a break towards the pivot (or retracement) will provide market entry.
Just like the retracement market breaks the pivot and moving beyond the 0 is considered as fib expansions or extensions.
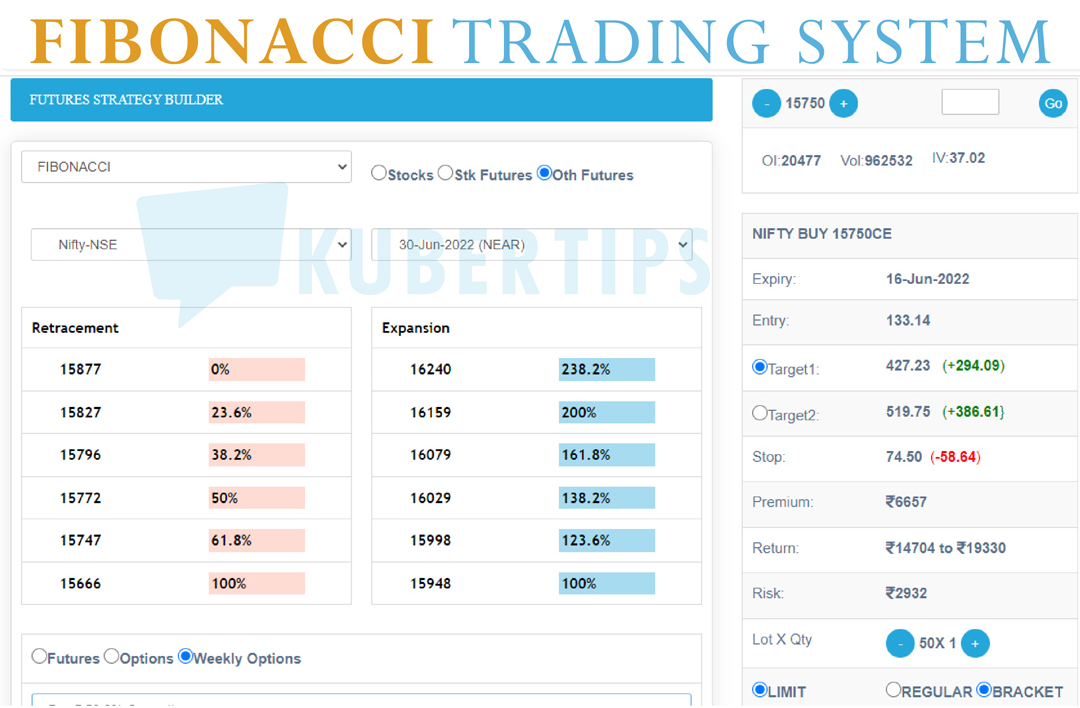
TradingBee provides a Fibonacci strategy builder for day traders. By selecting particular security, traders will get 5 each Fibonacci retracement and expansion level. Any strong support level will be considered as the buy/sell point and the nearest two extension levels as targets. A move below 61.8% is considered a stop or exit from the trade.
The Fibonacci strategy builder will create a forecast with trend, entry, exit, and stop. TradingBee's Signal Conversion and Order Routing Engine (SCORE) will convert this to a Future/Option trade or a spread strategy order depending on the trend.
0 Comments